Utah Royals: How Did We Get Here?

Updated: Jul 3
You've been watching it happen in real time: Utah's wins are stacking up! The table honestly looks absurd. We're sitting at the top of the NWSL, and frankly, some of us are still frantically checking the standings to make sure it hasn't all just been a fever dream. Utah currently sits in 2nd place, but we're actually in first when considering the points per game (San Diego in spot #1 has played 1 additional game).
Many are shocked that Utah's done so well, and a lot of people don't yet believe the team's success has been earned. Hopefully this blog post can outline all the ways in which the Royals have definitely earned their place at the top of the league!
I went deep into Fotmob's per-90 percentile data for every current Royals player across the 2024, 2025, and 2026 seasons to try to highlight some of the major changes the team has made over the past few years to get where they are today.
What I found is that the rise of the Royals isn't one big story. It's about 5 or 6 smaller ones, all coming together. The short version: the strategy finally crystallized around a group of players who were always capable of this. With a patient coaching staff and front office, the Royals were able to weather the storm to develop the roster instead of completely overhauling it.
Royals "3.0" isn't a new team. It's the same people, in the right roles, at the right time, finally playing to their ceiling.
Here are some data terms that might be helpful to know before we dive in:
Average clean sheet percentile: The proportion of matches the player finished without conceding a goal while they were on the pitch when compared to other players in the same position. A higher number here indicates that the player has more clean sheets than others in their position.
Goal contributions: This is the sum of a player's goals scored and assists provided.
Defensive contributions: The total number of tackles, interceptions, clearances, and blocks a player makes.
Aerial duels won: This is a measure of how many times a player successfully retrieves or connects with a ball contested in the air against an opponent.
Aerial duels: This is simply how many times a player entered into an aerial contest for the ball, and does not specify if they won the contest.
Expected goals (xG): The likelihood that a shot will result in a goal. In other words, a measurement of how good the chance was. A player or team's total xG in a match can give an indication of how many goals they could have expected to score, given the quality and quantity of the chances they created.
Fouls won: This measures the total number of times a player was fouled by an opponent, resulting in a free kick.
Chances created: The final pass leading to the recipient having an attempt at goal.
Expected assists (xA): a measurement of the quality of the chance created by a player, based on the likelihood that a pass will become an assist. This means that a pass that puts a forward through on goal will have a higher xA than a pass outside the 18-yard-box, even if both result in assists for the player.
It is important to note that the passing player still gets credit for the quality of their pass, whether or not the receiving player is able to convert it into a shot or goal. This means that it is not reliant on the finishing ability of the receiving player, but solely the quality of the pass provided.
The Data Story
Chapter 1: Ana Tejada Finally Got the Right Job Description.
I know, I know. I've talked about Tejada a lot. But bear with me, because the data tells a story here that I don't think we've fully appreciated.
In 2024, Tejada's per-90 minutes numbers look almost contradictory. She was finishing in the top percentiles for shots and goal contributions, probably because she was being compared against other center backs. Looking back at the 2024 lineups, there were multiple times where Tejada was the only center back in a 3-back lineup (even Del Fava was on the wing then). Her defensive contributions that year were in the 26th percentile. She was everywhere and nowhere at once. The team was leaking goals while she was on the pitch at a rate in the 52nd percentile for goals conceded. Not bad, not great, very meh.
In 2025, the shooting numbers dipped as she started being compared against other midfielders. Tackles improved, but her overall defensive metrics stayed in the 19th percentile. This is what transitions look like in the data: messy. The role was changing, but the system around her wasn't organized enough to let it work. Goals conceded with her on the pitch actually got worse (23rd percentile), and it was frustrating to watch at times. Tejada was just too slow to cut it as a defensive mid.
Then 2026 happened.
At the end of last season, Tejada went to coach Jimmy to talk about her role on the team. Apparently, they had an incredibly honest conversation, and Jimmy has expressed admiration of Tejada's work ethic and commitment to improve. With good coaching, Tejada has started to make some serious improvements, which are evident on the pitch. In a recent Soccerwise interview, Jimmy mentioned that Tejada has broken multiple personal records for speed this year, which is exactly what we needed to see from her!
This year, her clean sheet percentile jumped to 84th. Goals conceded while she's on the pitch? 92nd percentile. She's also contributing in transition at the 68th percentile for assists, meaningfully creating shots and big scoring chances. She has become the anchor that Coenraets has been building toward since he took over: a DM who controls the middle third, insulates the back line, and contributes going forward without abandoning her defensive responsibilities.
The version of Tejada we saw against Seattle (the one with a Tejada assist, shot off the crossbar, and incredible defensive performance) is what the data has been pointing towards for the last three years. Jimmy just needed time to train her up and build the system around her. But it wasn't all Jimmy. Tejada has shown an incredible propensity for growth and self-improvement, and I can't wait to watch her continue to develop over the course of her career.
Unfortunately, right after I wrote this, I saw that the Royals chose to decline to exercise their option for Tejada for 2027. This means Tejada is officially a free agent, and will unlikely be with the Royals next year. I really hope she’s able to find a new team in the NWSL, so we can continue to watch her grow in the league! All the best, Ana, and thank you for your contributions to this team ❤️
Chapter 2: Kate Del Fava Quietly Becoming Elite

Kate played every available minute in 2024 and 2025, and she's on track to do the same this year. This gives us some of the cleanest longitudinal data in the whole dataset. No injury asterisks, no sample size concerns.
In 2024, she was already one of the hardest-working defenders on the pitch in the 94th percentile for defensive contributions, but the team was still conceding heavily while she was out there (26th percentile for goals conceded on pitch). She was working hard, but the system wasn't translating individual effort into team-level results.
The shift happened in 2025, and it's subtle but significant. This is when her aerial game exploded. Aerial duels won goes from the 64th percentile to the 96th and her total number of aerial duels went from 42nd to 83rd percentile. She also started to become a real offensive threat: 71st percentile xG, 81st percentile touches in the opposition's box. Here, her clean sheets improve to 62nd percentile.
And now, in 2026? The numbers are just.. incredible! 100th percentile aerial duels won, 100th percentile aerial duels overall, 96th percentile xG, 88th percentile defensive contributions. Her clean sheet percentile now sits at 80th.
Kate Del Fava is playing at an elite level right now, full stop. It's truly no surprise she was called up to the USWNT U-23 team for their last set of friendlies. The reason her individual excellence is finally showing up in team-level outcomes is that the structure around her is finally working well enough to let her dominate rather than scramble to do damage control in the back.
Chapter 3: Mina Tanaka, From Contributor to Conductor

Tanaka's 2024 season was only 511 minutes, but the numbers were teasing us even then. She was 91st for percentile shot creation and 87th percentile for fouls won. That second stat is a sign of a player who draws pressure, wins contact, and makes space for others. The real question here was whether the team could build around her properly.
2025 gave us the full picture on Tanaka: 1,991 minutes, 77th percentile for goals, and a defensive work rate that surprised people who only think of her as a creative attacker (64th percentile for defensive contributions, up from 34th in 2024). She wasn't just being asked to attack, she was pressing, covering, and doing the less glamorous work that defines a complete attacking mid.
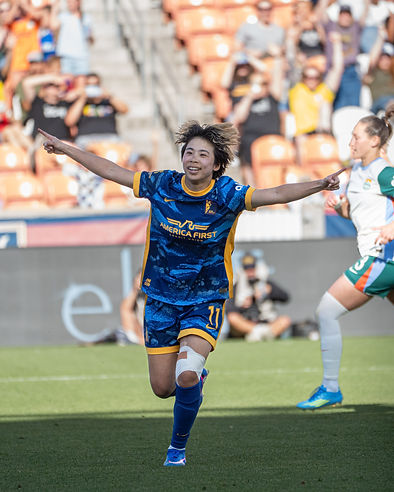
But 2026 is genuinely something else. 83rd percentile for goals, 86th for xG, 95th for assists, and 97th percentile for clean sheets while on the pitch! Those numbers can't be argued with.
That last number is one that really sticks out. The Royals almost never concede when Mina is on the field. That's not a coincidence. It reflects her ability to press, and counter-press, with spatial awareness and positioning to actively shape the team's defensive structure from the inside out.
Tanaka's shot output is also incredible. With Tanaka contributing a winning goal in 5 of 7 of the seasons' wins (according to research from Attacking Third), she's a major attacking powerhouse as well. Tanaka really is everything you would want in an attacking mid, and I am SO SO happy we have her on contract through 2028.

Chapter 4: Thomsen and Rabano - The Fullback Revolution
Photos courtesy Utah Royals FC
One of the things I love most about this team is how the fullback positions have transformed the entire attacking structure. Let me show you what I mean.
Janni Thomsen (right back) arrived in 2025 with a profile that raised eyebrows for a right back: 70th percentile xG and touches in the opposition box was in the 72nd percentile. She was clearly pushing high and getting into dangerous areas. She just wasn't converting that presence into consistent output yet. Crossing numbers sat at the 35th percentile, chance creation at the 22nd. The attacking intent was there; the productivity wasn't.
Fast forward to 2026: 77th percentile for crosses, 67th percentile for chances created, and 58th percentile for expected assists. She's punching above her weight here as a fullback, and she's found her rhythm on the right side and turned into a genuine attacking threat.
Edited to add: unfortunately right after I published this the Utah Royals announced that Janni was traded to the London City Lionesses. Janni will be greatly missed!!
Nuria Rabano (left back) might be the most dramatic single-year transformation on the entire team. In 2025, she was primarily a defensive left back at 100th percentile in tackles and 94th percentile in defensive contributions. She was elite at stopping things (particularly after the summer break), but her attacking output wasn't great: 33rd percentile crosses and 52nd for chances created.
In 2026? 100th percentile for successful crosses and 94th for crossing accuracy. She's also 96th for chances created, 88th for assists, and 96th for xA. She's become one of the most dangerous attacking fullbacks in the league. Coenraets appears to have made a deliberate tactical decision to push her (and Thomsen) further forward and trust the midfield structure to cover. The Palacios goal against Portland, with the perfect ball from Rabano dropping right in front of the goal, is exactly what that looks like in practice.
Chapter 5: Cloe Lacasse and the Injury Comeback

You know this story already, but the data puts it in stark relief.
2024 (665 minutes, healthy): Cloe joined the Royals late in the 2024 season with an August transfer. She made an instantaneous difference in the team's results with the team's first hattrick against Seattle. She was 94th percentile for goals and 100th for chances created that year. At the end of the season, however, she suffered an ACL injury, leaving her out for the majority of the 2025 season.
2025 (706 minutes, injured): When she returned to play in August, 2025, her output dropped significantly. Goals were just the 38th percentile, xG was 30th. She wasn't back to full fitness, and the numbers show it clearly. But here's the interesting thing: her xA climbed to 80th percentile, and her crosses stay in the 85th. Even though she was running at reduced capacity, she still found a way to create chances for her teammates.
2026 (954 minutes, healthy): She's SO back. At 75th percentile for goals, 94th for chances created, 89th for BIG chances created, 88th for xA, and 90th for crosses, her attacking output is insane. And then the number that shows how much she's grown as a complete player in this new Royals system: 85th percentile for defensive contributions. In 2024, Lacasse was only at the 5th percentile here. She has become a genuine threat both directions, which makes her even harder to play against.
This is Jimmy's vision embodied. With the emphasis on counter-press this year, most attackers are having better defensive stats. This pairs well with the push for attack-minded defensive players, creating a well-rounded, balanced, and tactiacally challenging team with the ability to maintain control throughout the pitch.
As I mentioned in the Denver recap, she's only completed four full 90-minute matches since returning from injury. As she gets back to full fitness, the ceiling here is extremely high. The team's results directly correlate with her availability and health, and the data backs that up.
Chapter 6: Lara Prasnikar Deserves Her Own Moment

Prasnikar is a legit super sub for the Royals. Truthfully, I'm not entirely sure why she isn't starting. She only has 292 minutes this season, and yet, she's 100th percentile for goals, 94th for xG, 92nd for shots on target, 90th for xA, and 92nd for chances created. Per-90, Lara is producing at an almost unbelievable rate in her limited time. She is the definition of a super-sub who makes our bench a genuine threat rather than a drop-off. That's rare, and it matters in a league where a lot of games are decided in the final 20 minutes.
The Part that Doesn't Show Up in the Data
The data tells a compelling story, but it doesn't capture everything. It doesn't capture Paige Cronin's energy. Remember that flying 50-second opener against Seattle? The data also doesn't capture the chemistry she's built with Thomsen down the right side before her injury (we miss you, Captain Paige! Come back soon!).
The data also doesn't fully capture what Mia Justus contributed while McGlynn was out. She stepped in and provided reliable goalkeeping during a stretch when the team needed steady hands.
And it definitely doesn't capture what Jimmy Coenraets has built culturally. Rumi coming off the pitch in Seattle just saying "I love this team" isn't in any spreadsheet. But it's the reason these percentile numbers are moving in the right direction. Players who love where they are work harder, communicate better, and develop faster. The data is just a downstream result of the culture and commitment.
Stats sourced from Fotmob per-90 percentile rankings, comparing each player to positional peers across top-tier women's leagues. All percentile data reflects 2024–2026 NWSL seasons only (Utah Royals appearances). Season 2026 data is ongoing and will continue to update.


I’m even more pumped for the rest of the season now!